
How much time do you have left?
Yes, in that sense. The existential one.
If the question is difficult to ask, it’s even harder to answer. Ask an actuary. Calculating life expectancy is a complex matter; more complex, at least, then plugging your date of birth and today’s date into a function. An informative life expectancy depends on a host of additional factors, like your sex, current health, and lifestyle habits.
“Multifactorial” calculations like the one above dominate medicine, so it’s no surprise that they should dominate clinical research, too. Take a plasma urea level of 39 mg/dL. Is that above, below, or within the normal range? The question is misconceived, because normal in this case is relative to patient age. A 30-year-old’s “slightly above normal” is a sixty-year-old’s “slightly below normal.”
Age is only one factor. For many ranges, patient gender, ethnicity, and co-morbidities, in addition to age, determine a normal range. Often, researchers can set these factors aside without raising undue safety concerns or undermining the generalizability of their results. But as personalized medicine continues to inform drug discovery and clinical care, researchers will turn to more finely-grained reference data more often. For this reason, data management systems must make it easy for these researchers to apply reference data that’s sensitive to as many factors as they choose.
Of course “easy”, just like “slightly below normal”, is a relative term–for the most part. In no context is a writing a lengthy formula of nested “if, then” clauses easy, e.g.
If the participant is male and Hispanic and between 18 and 25 years old and the test is for ALT, then set the lower limit to 12 U/L and the upper limit to 102 U/L, and if the participant is male and Hispanic and between 26 and 34 years old and the test is for ALT, then set the lower limit to…
Completing the formula above would mean assigning a lower and upper bound to every combination of gender, ethnicity, and age range. The process could easily take hours, just to set the normal limits of ALT. If the study involved a dozen analytes, the data manager would need to devote the better part of a week to programming these constraints. If, at a later date, any one of those constraints changed, he or she would face the unenviable task of modifying (without breaking) the original formula. Too many “modern” EDC systems force the data manager to soldier through this error-prone task. With paper, it’s a non-starter.
How much better, then–for efficiency and quality–to rely on a general constraint; one that leverages a tool that’s easy to build, easy to read, and easy to amend? I’m talking about the humble table.
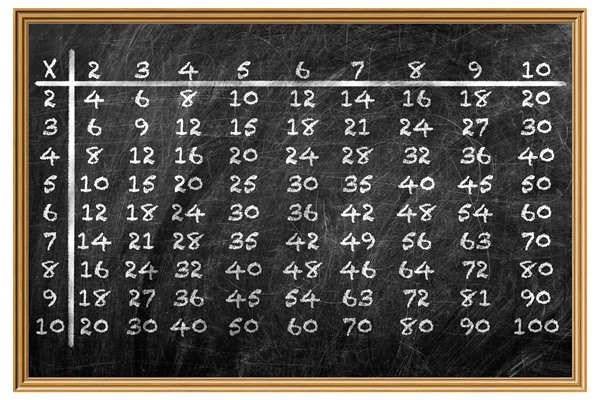
Remember this table?
Yes, the table. For all our advancements in data architecture, the same grid that set us on the path to multiplication in second grade remains an asset today. It’s human readable, it’s intuitive, and it’s powerful.
Powerful? Really? How much can you accomplish with just two axes?
Great question! It’s true that most spreadsheet applications don’t offer more than two axes, at least not through their GUI. But who needs them when you have thousands of rows and hundreds of columns at your disposal?
Suppose I need to assign a unique value to every combination of three hand preferences (left, right, or ambidextrous), four eye colors (blue, green, brown, or hazel), and the eight blood types (O,O-,A+,A-,B+,B-,AB+,AB-). At first blush, it seems a table won’t suffice. I have more dimensions (three) than I do axes (two). But a single axis can accommodate any number of dimensions, because nothing prevents me from treating each combination of values on those dimensions as its own, n-factored value. For example, I can treat each triad of handedness, eye color, and blood type as one of 96 phenotypes.
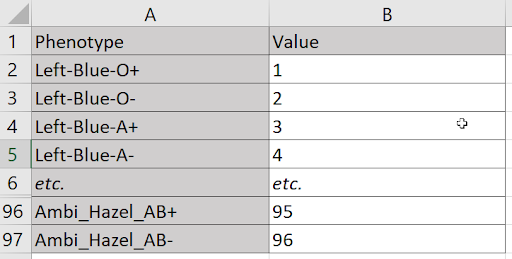
Laying these combinations along a vertical axis, I can assign a value to each with just two columns.
Maybe I’m partial to a more compact format. If so, I can combine the variables from two dimensions to specify one axis, and let the variables from the third dimension define the other:
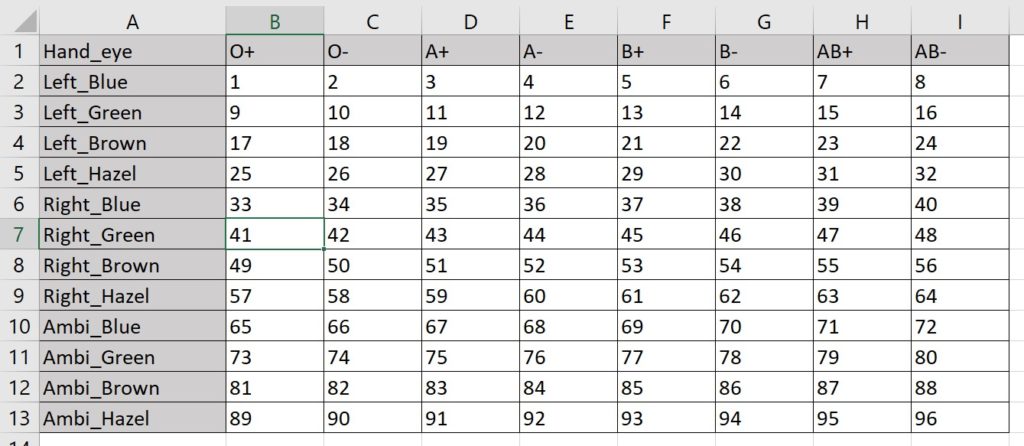
Here I make the 96 assignments with 13 rows and 9 columns. (The virtue of this method is fewer total cells.)
In any case, I’m free to work with as many factors as the situation demands, and distribute them between the two axes in any way that makes the most sense to me. Leaning on a familiar format, I’ve made the difficult part of a multifactorial reference much easier. All that remains is to add to the form a simple instruction for “looking up” the values needed. Even if those values change, the form doesn’t need to.
Fair enough. But won’t real use cases require gargantuan tables?
Sure. But what’s gargantuan to you and me is a walk around the block for the right technology. OpenClinica’s EDC relies on fast and flexible XForms to move data through a nimble, microservices architecture, so “clinically-sized tables” pose no threat to smooth performance. Consider these common parameters:
- 81 ages (18 years old to 99 year old)
- 6 ethnic and racial categories
- 2 genders
- 40 analytes
- 2 limits of normal (one upper, one lower)
A mere 972 rows (plus one header) accommodates every combination of age, ethnic and racial category, and gender. 80 columns (plus one on the left for analyte names) accommodates the 40 lower and 40 upper limits. The resulting 973 x 81 grid is small potatoes for database applications that power software like OpenClinica’s. Simple formulas in that context can retrieve the value from any coordinate within milliseconds.
Great. But what’s the big deal? I hardly ever need to apply reference data for this many factors at once.
Yes, a heart rate is a heart rate, and while population differences might exist for this measure, they’re hardly a concern on your vitals form. But don’t confuse the frequency of a need with its importance. Take safety. An insignificant drop in a lab value for one patient may portend real danger for another. Even apart from lab interpretation, though, tables can drive efficiency and accuracy. Dosing can vary between countries participating in the same study, due to differences in labeling and regulation. The same goes for eligibility and arm allocation. Whenever we try to account for these variables within our form, we accept programming delays and chances for error that we don’t need to accept. It is possible, of course, to make an error when assembling our table, but those errors are easier to spot and correct within a grid than they are in some extended, conditional formula. The tables themselves are easier to build in the first place, too, as their source data usually comes to us in the form of a spreadsheet. A little re-labeling of our first row and column, some testing, and viola: trusted references values are now a part of our study.
The lesson is simple, then. First, make sure you’re using the right EDC. Your form builder should allow you to specify reference data with tables, and your forms themselves should retrieve values in that table based on user input all but instantly. Second, use your two axes to their full potential: fill those rows and columns with as many dimensions as are relevant by tapping some basic combinatorics. Third, congratulate yourself.
You’ve just used a bit of the time you have left more wisely.
Real-world example: applying lab reference data that’s gender- and age-specific for two analytes
Not every analyte carries with it age- or gender-specific normal ranges. But for those that do, their differences are critical. In this example, I’m concerned with two levels from a blood serum panel: Insulin-like growth factor 1 (IGF-1) and Dehydroepiandrosterone-sulfate (DHEA-S). Both play a key role in several endocrinological disorders, and both have normal ranges that vary by age and gender.
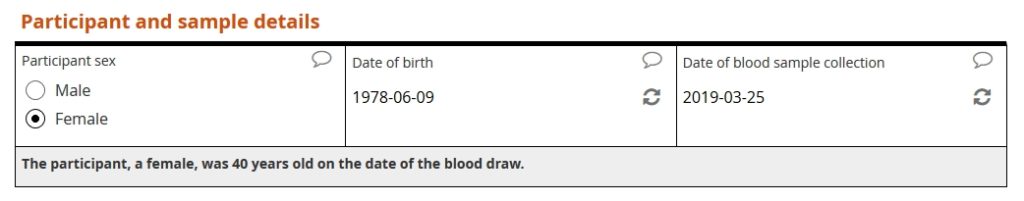
Our example form first asks the user to specify the patient’s sex, patient’s date of birth, and date of sample collection. The form then calculates the patient’s age, in years, at the time of collection.
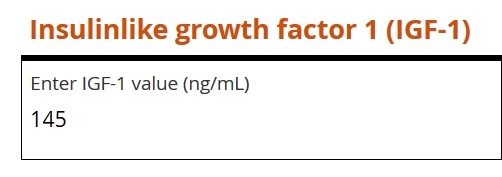
Next, the user is prompted to enter the value for IGF-1.
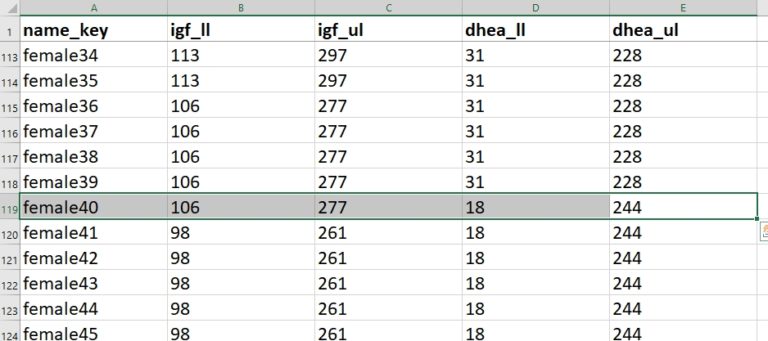
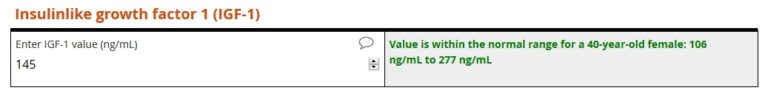
The lower limit of normal (igf_ll) for a 40-year-old female is 106 ng/mL. The upper limit (igf_ul) is 267 ng/L. Because the entered value of 145 falls within that range, no query is raised.
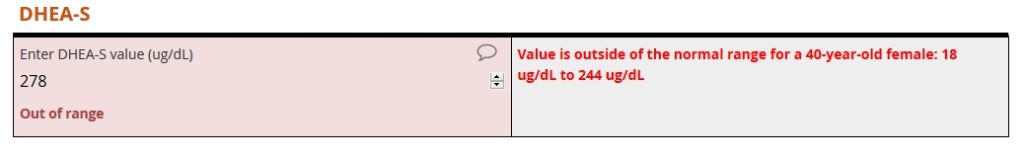
The form then prompts the user to enter a DHEA-S level. For this analyte, the user enters 278 ug/DL. That value is outside the range for a 40-year-old female. As a result, an auto-query instantly fires.
The full reference table includes 191 rows…
- 1 header row
- 95 rows for men aged 18 to 112
- 95 rows for women aged 118 to 112
… and 5 columns…
- 1 column for the gender-age combinations
- 1 column for IGF-1 lower limit
- 1 column for IGF-1 upper limit
- 1 column for DHEA-S upper limit
- 1 column for DHEA-S lower limit
Introducing racial and ethnicity categories, along with more analytes, would multiply the area of our table. Six racial and ethnic categories combined with two genders and 95 whole-year ages would generate a total of 1,141 rows (6 x 2 x 95 combinations plus 1 header row). Specifying the upper and lower limits for three dozen analyzes would occupy 73 columns (2 limits x 36 analytes + 1 label column). The resulting 1,141 x 73 table would contain 197,393 cells, a total that’s 206 times greater than our original table’s cell count. Should you expect a proportional decrease your form’s response time? Not at all! The “lookup” still happens within milliseconds.